’22 State of the Industry: Could Golf Currently Support More Supply?
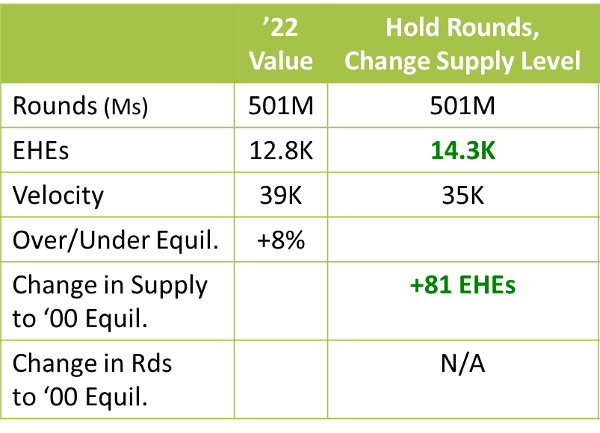
Continuing our select release of interesting facts from the 20th edition of our definitive State of the Industry assessment, the surprising answer to the above question is “yes.” The below extract from our 75-slide numbers-fest, which was delivered by Jim Koppenhaver and Stuart Lindsay during the PGA Show in January, applies the supply/demand balance methodology and math that they’ve consistently tracked for the past 10 years:
The persistent COVID demand surge has provided this sudden and significant reversal of fortune (from a stubborn, multi-year supply glut) Supply was only shrinking fractionally annually before COVID, it continues at that rate so the favorable balance is all due to increased demand.

Now, before all the economic beneficiaries of building new courses (particularly the real estate developers) attempt to take this message viral and repeat the industry’s last mistake, the caveat which we outline in the video of our Orlando presentation, is that, if we’re going to do this, we have to have more diligence (and independent perspective) in market analysis for both the level and type of supply needed. For more details on the above finding and our recommendation for “smarter growth” this next phase, you’ll find it in the full SoI.
That cautious pro-growth assessment and other observations and trends are now available for purchase from Pellucid one of three ways:
- Purchase a Pellucid Publications Membership, $495 annual; includes:
- ’22 State of the Industry (75 .ppt charts, access to web video presentation)
- Monthly Nat’l/Reg’l/Mkts weather impact tracker
- Monthly Outside the Ropes digital newsletter
- National Golf Consumer Franchise Scorecard (size/change/demographics)
- Subscribe to the Golf Market Research Center (facility owner/operators/MCOs), $500 annual per facility; includes:
- Local Market Snapshot (golfers, supply/demand balance, velocity etc.)
- Monthly trend comparative graphs for Rounds & Utilization
- Current month and Year-to-Date Key Performance Indicators Scorecard
- Access to facility-specific Cognilogic (historical) and Foresight (60-day forecast) web reports
- ’22 State of the Industry (75 .ppt charts, access to web video presentation)
- Purchase ’22 State of the Industry report, $275; includes:
- 75 .ppt charts
- Access to 90-minute web video presentation via web
We never thought we’d see the day in our lifetime when the numbers would “flip” from oversupplied to undersupplied but, if we consistently apply the math (which we’re analyst-bound to do), the COVIdend has tipped the scale. For all of those stakeholders who are itching to “build something”, this will give you some facts upon which to “build” your argument as long as you pay attention to the market dynamics vs. your desires (we can help there as well with our Golf Local Market Analyzer software).


