

Platform Transforms Captured Data Into Interactive Graphics Designed to Reveal Where Golfers Consistently Gain and Lose Strokes
(NEW YORK) – AVA Golf™, the platform designed to transform golf performance data into personalized improvement, has introduced a series of proprietary performance visualizations that turn shot data into powerful, interactive representations of how golfers actually play.
The visualizations, including hole-by-hole performance mapping, approach and chip dispersion, and lag-putting analysis, help golfers identify recurring tendencies and better understand the factors influencing their scores.
Unlike traditional platforms that primarily present performance data through individual shots, statistics and round summaries, AVA Golf brings multiple data points together to reveal patterns that can be difficult to otherwise identify. The result is a more intuitive way for golfers to understand their strengths and pinpoint areas with the greatest potential for improvement.
“Golf technology has done an incredible job of collecting data, but collecting more data isn’t necessarily the same as understanding your game,” said JR Charles, Founder and CEO of AVA Golf. “We wanted to take all of that information and make the patterns visible. When you can actually see where your shots are going and how those tendencies repeat, you can begin to understand what’s really happening and what you should work on next.”
AVA Golf’s interactive visualization suite includes:
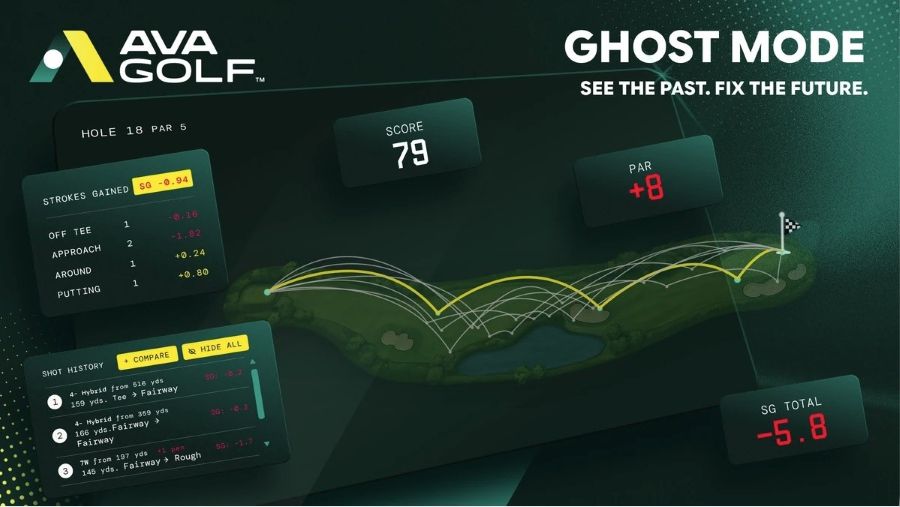
Ghost Mode: Golfers can layer every previous attempt at a hole over their current round, creating a history of how they have played it over time. Repeated tendencies, such as tee shots consistently missing in one direction or approaches repeatedly finishing short, become immediately apparent.
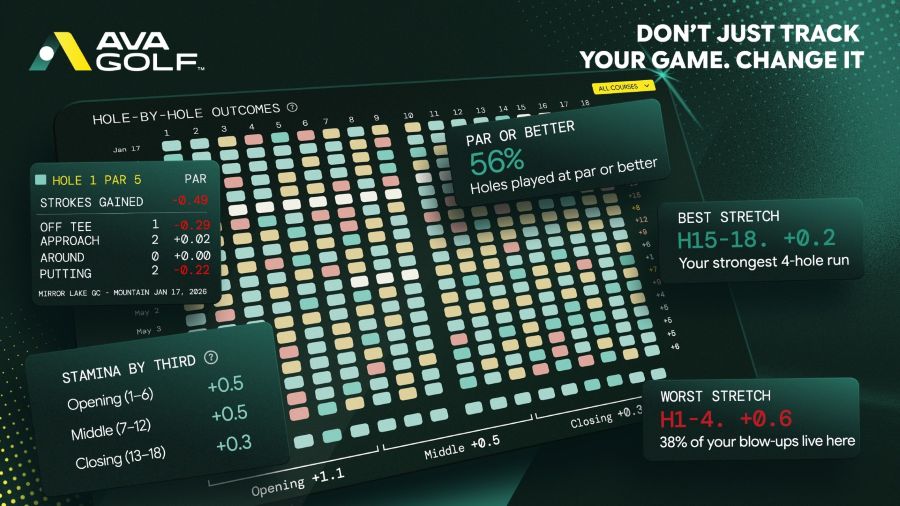
Hole-by-Hole Outcomes: Every hole from every round is displayed in a single grid and scored against par, providing a record of where a golfer consistently performs well or struggles. The graphic also reveals performance by third of a round, best and worst stretches and par-or-better rates.
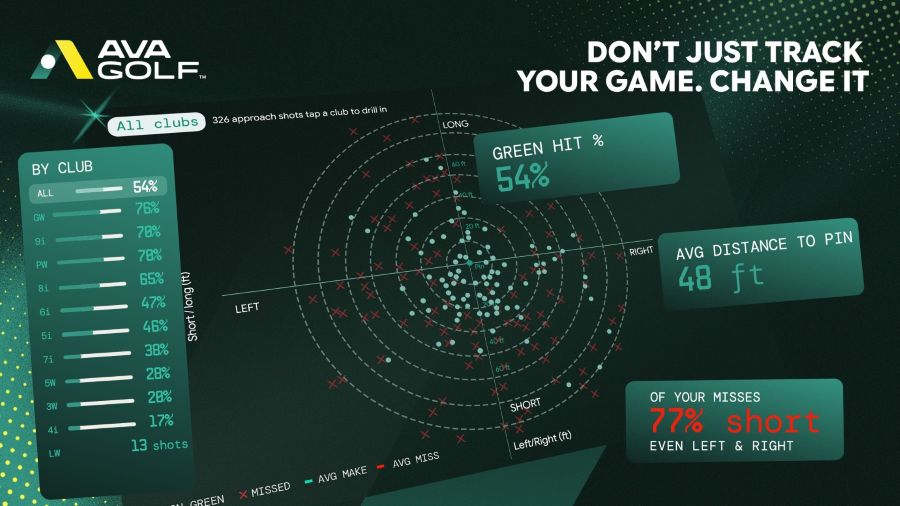
Approach Dispersion Chart: Every approach shot is plotted around the pin. The visualization distinguishes greens hit from misses and can reveal green-hit rate by club, average proximity to the hole and whether misses tend to finish short or in a particular direction.
Chip Landing Chart: Every chip is plotted according to where it finishes relative to the hole, with results showing shots that finish inside 10 feet, between 10 and 25 feet and beyond 25 feet. This provides a clear picture of a golfer’s short-game tendencies and the quality of scoring opportunities.
Where Lags Finish: Long putts are plotted according to where they finish around the hole, focusing on a golfer’s lag-putting performance from 15 feet and beyond. The graphic shows tap-in rates, average leave distance and directional tendencies, helping golfers identify speed-control patterns that can contribute to difficult second putts and three-putts.
“Most golfers can tell you their score and probably their handicap, but that doesn’t necessarily tell them where they’re actually losing strokes,” said Aron Schüler, Director of Engineering for AVA Golf. “We’re giving golfers a different way to look at their performance. Instead of asking them to interpret a spreadsheet of numbers, we’re showing them the patterns those numbers create.”
The interactive graphics are part of AVA Golf’s broader approach to turning performance data into personalized improvement. The platform connects with technologies golfers already use, analyzes data from rounds and practice sessions, and identifies the performance trends with the greatest potential impact on scoring.
AVA Golf then takes that information a step further by delivering personalized instructional video playlists focused on those areas. Its three-step philosophy is summed up as: Activities. Performance. Improve.
The approach addresses a growing challenge in golf technology. As more golfers adopt connected devices and apps, the amount of information available to them continues to increase. According to the National Golf Foundation, among core golfers (defined as those who play eight or more rounds a year) more than 75% have at least one golf app on their phone. Yet access to more data does not necessarily make it easier for golfers to determine which numbers matter most or what they should do about them.
“Golfers don’t need another dashboard full of numbers,” Charles said. “They need to understand what those numbers are telling them. AVA Golf is turning data into a story about their game, and that story gives us a much better foundation for improvement.”
AVA Golf launched with an exclusive instructional library featuring many of golf’s most respected teachers, including Golf Digest “50 Best Teachers in America” Cheryl Anderson; GOLF Magazine “Top 100 Teachers in America” Mike Malizia; Jason Birnbaum, instructor to five-time PGA TOUR winner Chris Gotterup; PGA TOUR Golf Academy coaches and other nationally recognized teaching professionals.
Additional technology integrations and platform capabilities are planned as AVA Golf continues to build its connected ecosystem and pursue its long-term vision of becoming the intelligence layer that helps golfers unlock greater value from the technology they already use.
Golfers can learn more about AVA Golf at avagolf.com.
About AVA Golf™
AVA Golf is a golf performance platform designed to transform the data golfers already collect into personalized improvement. By connecting with golfers’ existing technologies, AVA Golf analyzes performance from rounds and practice sessions, identifies the trends with the greatest potential impact on scoring and delivers tailored instructional video playlists focused on each golfer’s individual needs. Through its combination of performance analysis, proprietary visualizations and personalized instruction, AVA Golf helps golfers better understand their games, practice with greater purpose and improve faster.
MEDIA CONTACT:
Stephen Reynolds
Reynolds Media Group
703-344-6031