

July ’21 Industry Health Metrics vs. July ’20: We Know Considerably More This Year
This time last year we were on the cusp on an unprecedented surge in both demand (rounds) and participation (new & returning golfers) but we had limited breadth of visibility to either see it coming or track it during the surge. This led to Pellucid’s decision in January ’21 to launch our Golf Market Research Center (GMRC) so that, during and at the end of the ’21 season, our clients and Pellucid would know more of the key metrics, the trendlines and the forecast en route to December. Thanks to our merry little band of intrepid and independent thinking owner/operators (AKA the GMRC Charter Members), we know considerably more this July than past, some of which I’ll share with this broader audience tuned into the Pellucid channel (to get the full picture, you’ll have to join our merry little band for the princely sum of…$500/yr per facility).
The question before us in July ’20 was, “How much of a rebound will we get as one of the few “approved recreational activities” during COVID?” The question in July of ’21 is “How much of the rounds, revenue and participant surge can we retain as social restrictions due to COVID relax?” (complicated slightly by the unforeseen Delta strain emergence) Toward that end, we’ll take a past, present and future perspective on what we know using the GMRC and our 7 KPIs, courtesy of the national-aggregated results of our Charter Members:
What we knew in July ’20 – Rounds were up 20% vs. ’19 for the month (first month of the COVID “bounce”), that brought the Year-to-Date figure into positive territory (+3%) as well
What we know in July ’21 – As we lap the COVID surge months from ’20, rounds are proving resilient, golf revenue gains are even stronger and, coupled with the flat weather impact, Utilization and Revenue-per-Available Round (RevpAR) are equally robust. We also know that Rate-per-Played Round is stronger and the Discount Rate (Achieved Avg. Greens Fee compared to Peak GF Rate) is up modestly (that’s a positive indicator, I’ll explain in the article)
What we’re projecting in rounds demand for the balance of ’21 – I’ll share elements of Pellucid/Edgehill’s crystal ball, where we think the year end rounds number will land and what the odds are currently for Jim winning his Scott/Stuart bet (Jim’s side is we fall short of last year’s 493M rounds, right now the odds are favoring Scott/Stuart)
Given that we’re in the waning days of our call for Charter Members for GMRC (Charter Member benefits end 9/15) and a number of owner/operators we’ve solicited had said “wait until the season winds down”, I’m going to use this issue as a teaser to get more of you onboard by distributing the full issue to our full list of Pellucid “sympathizers.” If I had you at hello, then you can use the below instructions to join our existing subscribers to have superior performance tracking including weather impact and across our 7 KPIs:
- Subscribe to the Golf Market Research Center (GMRC) – We’re in the Charter Member subscription period (6/1-9/15). Facilities subscribing to GMRC ($500/yr, $450 for NGCOA members) during this period get the following value-added services as part of the “bundle”:
- OtR annual subscription (monthly articles like this one, wide range of topics)
- ’20 State of the Industry report suite
- Cognilogic Weather Impact: Historical facility-specific Golf Playable Hours & Capacity Rounds, accessible daily via web portal
- Cognilogic Foresight: 60 day forecast of Capacity Rounds including comparison to prior year, the 10-year norm and select forecast facts (i.e. hi/lo temp, precipitation amount etc.), accessible daily via web portal
- GMRC program revshare: Set up as a cooperative, Charter Members will get annual discounts on their service based on the number of participants and revenue through GMRC in Year 2 and beyond
- Three ways to get more information on the program:
- By reading the 2-pg program summary or
- By viewing the 18 minute webinar demo by yours truly (you have to register to view the video, don’t worry, you’re not signing up for anything, we just want to know who’s viewing our content as the quid pro quo)
- If you’d like to “test drive” it by putting in your ’19-’21 monthly figures, we’ll let you do that for 2 weeks, just email me to get registered & access
July ’20 was the start of something big, but all we could see was a double-digit rounds bump.
As most of our readers know, our $25B+ golf operations industry (just focusing on golf facility revenues) has subsisted for years largely on the good graces of Golf Datatech which has provided, since 2000, free of charge, monthly rounds reports on % change at the national, state and select markets level. Thus it was that in July of ’20 we knew the following facts about what would be, in retrospect, the initial month of the COVID surge for golf operations:
- The month was +20% compared to ’19 and that Private clubs benefitted slightly more in rounds gains than Public facilities
- The YtD figure was +3% which marked a return to positive territory after being ravaged in Mar-May by double-digit declines (courtesy of COVID restrictions), again Private Clubs’ gains significantly outpaced their public counterparts
What we didn’t know were things like:
- Did Golf Revenue accelerate in tandem, more or less than rounds?
- If Golf Revenue accelerated, how much was due to the increase in demand vs. an increase in rate (or equal parts of both?)
- How much of that demand surge could be attributed to favorable weather vs. pure increased interest?
- What role, if any, did rate discounting play in the surge?
Enter the GMRC which, with the benefit of our subscribers putting in their historical Rounds, Golf Revenue and Peak Greens Fee, allows them to turn back the clock to any period of time and see what the world looked like in July ’20 vs. their previous years’ performance:
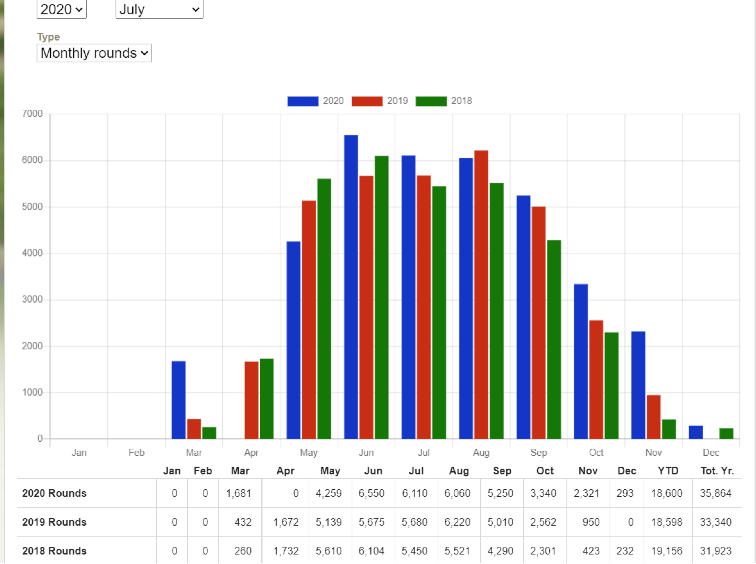
Here we can see that, for rounds, July ’20 was a great month compared to July ’19 (and ’18 for that matter, just to show that ’19 wasn’t a single year anomaly) and, in the YtD column you can see that they had basically through July managed to scratch their way back to the ’19 level. To the question of Utilization (how much was due to just better weather), they can toggle to that KPI:
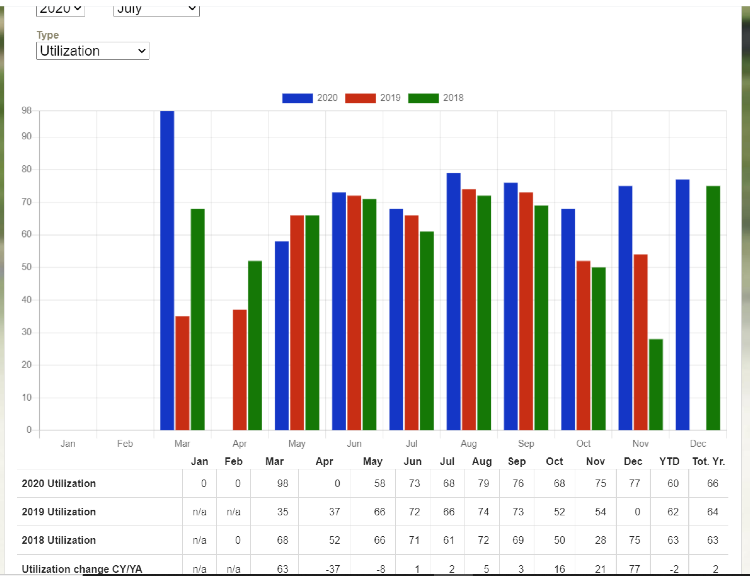
We can see by the increase in July Utilization that the rounds gains were “pure” increased demand by local golfers (blue bar beats red bar, from the table the value was 68% topping ’19’s 66% by 2 points).
By aggregating these numbers across the entire GMRC subscriber “portfolio”, we’re now able to both have better, broader visibility regarding how ’21 is playing out as well as being able to reconstruct and study what happened in ’20 vs. ’19. Importantly, for many of our clients, they’re using the ’19 figures and the ability to directly compare them in the tables and graphs above to determine how ’21 is playing out vs. a “baseline” year (’19) either in addition to or ignoring ’20 as the anomaly year. So, to the extent that our current subscriber network allows (based on size, geographic dispersion and our math skills to project and balance), we’re rapidly getting much better visibility into what’s happening at the macro level while our subscribers focus on their performance and, in some cases, the market-level figures we’re able to provide early on. Moving on to what July ’21 tells us…
What did July ’21 look like through our GMRC lens at the portfolio/national level?
The GMRC is built on 7 Key Performance Indicators (KPIs) that are a combination of industry standards as well as a couple that Stuart and I came up with from our combined experience:
- Rounds Played
- Golf Revenue (greens fees, carts, memberships/season passes/loyalty programs etc.)
- Revenue per Played Round
- Capacity Rounds (weather-adjusted and based on a static hourly throughput)
- % Utilization
- Revenue per Available Round
- % Achieved Greens Fee (also known as the Discount Rate)
In the GMRC at the individual facility level it looks like this for our subscribers:
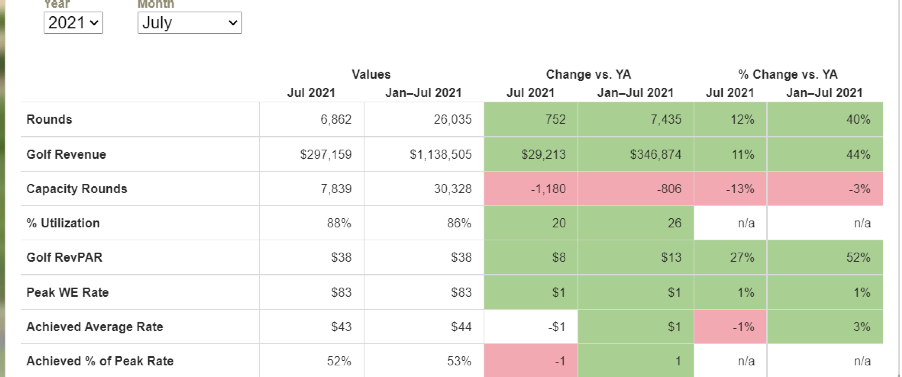
As we can see by the color coding (green = beat comparison period, red = lagged), there’s a lot of good news in this July scorecard, both for the month (a little surprising that rounds for this facility beat ’20 by 12% for the month; most of our participants saw modest declines) and the YtD with deficits in only weather (can’t change that) and a slight dip in Achieved Avg. Rate for the month.
Since we’re interested in what the portfolio (our current proxy for national) looks like in the aggregate, we’ll go to table format for this compilation that Pellucid does monthly (and provides the summaries for month, Year-to-Date and change vs. both ’20 and ’19 to our subscribers outside the GMRC platform):
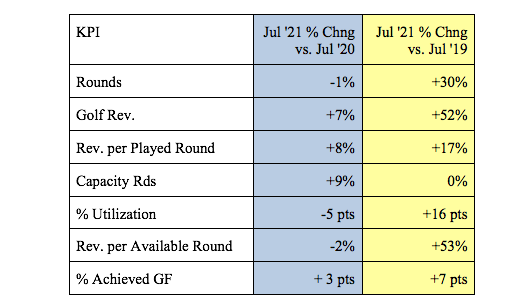
What we can see in the above comparison chart is (not surprisingly) the “comps” come back down to earth as we run into the big numbers we posted in ’20 post-COVID restrictions but, compared to the more normal baseline of ’19, we’re retaining healthy gains. Here I’m showing only the month (because I’m trying to seduce you into subscribing to GMRC to be part of the family and seeing the full story monthly) but I can tell you that the YtD numbers generally follow the same pattern (except that ’21 YtD Capacity Rounds are basically flat vs. the July favorability above).
What I’ve tried to demonstrate here is that, as the ’21 season progresses, Stuart and I are also making progress on our mission and vow to drag owner/operators to a place where we won’t be as blind come December on facility and overall industry performance as we found ourselves in last year. The end objective for our clients is to better understand the dimensions of their performance (not just rounds and not just revenue and not just how they’re doing against budget) and make better-informed decisions the balance of the season and into their ’22 planning (which is rapidly approaching). Speaking of where we’ll be in December, let’s finally move to Pellucid’s crystal ball based on the better information we have this year to inform it.
“Predictions are hard, especially about the future” (Yogi Berra).
Stuart has often said that he laughs at how hard very successful professionals, in a friendly match at his club, work to win a $2 Nassau bet. I guess the same can be said of me trying to figure out where we’re going to end up in December at the risk of losing a bet for 2 steak dinners at the restaurant of my competitors’ choosing. For those not familiar with the bet, in January of ’21 during a Golf Gurus podcast where I was asked my “call” for ’21 rounds, I told Scott Merchant of ClubProphet Systems with some confidence, “There’s no way we match ’20’s results come December, and if we only give back half the gain from ’20 vs. ’19 I’d call it a very good year.” He thought otherwise and the bet was on with colleague Stuart Lindsay later joining Scott’s side of the bet. Fast forward and the season was pretty much playing out as I had expected through April but then I was forecasting “givebacks” in the comps starting in May and escalating from there. Fortunately for the industry (unfortunately for my bet), what we’re seeing is the givebacks didn’t start until July and they’ve been more muted than I had expected.

I kind of feel like Jerome Powell and the Fed in stubbornly clinging to my original assertion while simultaneously having to revise upward my guidance based on the historical evidence as it comes in and piles up on the other side of the ledger sheet. To wit:
- I was fortunate that July came in negative vs. ’20 (-4% according to Golf Datatech, their Public figure was relatively close to our GMRC number which is the appropriate comp since we’re only working with Public, Regulation-length facilities at this stage). If July would have been a parity or plus comp (I called for -5%) then I would have had to seriously reconsider my annual projection
- As it were, the July result lopped 3M rounds off the “declining balance” method of tracking vs. ’20 but we’re still ~36M rounds to the good (good for the industry, bad for my bet)
- You can see above that I’m projecting declines vs. ’20 for all the remaining months of the year (declining balance figure is shrinking monthly). I’m projecting that the rate of comp decline will increase due to the strength of Q3-Q4 last year. I had initially factored in that I thought COVID would be in full retreat in H2; that obviously got dented by Delta
- My initial forecast was to “retain half the gain” which would have pegged us at ~465M rounds so you can see I’ve already had to adjust that January forecast significantly upward (which is good!)
August will be the next big “marker” as it concludes the largest single “quarter” (not a calendar quarter but rather July is golf’s apex month followed in importance by August then June so the Jun-Aug. trio of months is make-or-break generally for the industry). One of the other benefits of the GMRC is that we have, so far, been fortunate that our subscribers are engaged enough that they’re entering their values in the first 10 days of the month so we’ll have the “read”, projected up to the portfolio, for August shortly after the Labor Day holiday concludes. We provide them with the summarized results generally within 5 days so they have this reference point on or before the 15th (you could to if you subscribe, hint, hint).
If I Were King…
So there you have it sports fans, the past, present and future world of performance tracking and extending our visibility from just rounds % change to 7 KPIs, weather-factoring and, based on sample sizes and balance, reference points (currently the portfolio and 15 markets) and eventually market-level benchmarking.
To answer the most oft-asked question, “Does it cost money?” Yes. To answer the 2nd most-oft asked question, “Why?” Because Pellucid is a for-profit company, it costs money to build and run this type application and, frankly, Stuart and my information experience, intellectual property, blood, sweat and tears are worth something. To be even more candid, since we’re among friends here, we don’t start making any significant money on this until we’re at least a couple hundred courses in. The most recent question added to the list is, “There are (or announced) free options of performance tracking, why should we buy yours vs. just using free versions?” That could be the subject of a whole other OtR but succinctly, those options lack the tools (think weather, think market profiles etc.) and the experience (what successful commercial analytics products have they built?) of Pellucid/Edgehill. Additionally, I believe you’re going to find that all of them are going to be offered free as part of a required bundle of services (so…you’re going to pay for it, just not directly). The most important element of Pellucid’s GMRC as an independent, stand-alone offering is that we’re laser-focused on performance tracking, analysis and insights. We’re not selling you ancillary services and, importantly, don’t you want your tracking services provider to have a completely independent, non-interested opinion regarding which of your other services you’re buying is working or not? (i.e. your yield management, your marketing programs, your website etc.) All we want to be is the best information and insights provider in the industry, we think there’s value to the average owner/operator partnered with us in that role and we believe it’s more than worth the current price of admission of $500/yr.
So, if we didn’t have you at hello but we now have your attention, I won’t make you scroll back up to the top to get the information on how to subscribe to be a Charter Member of GMRC between now and 9/15:
- By subscribing here (if you’re an NGCOA member, email me for the 10% discount code) or
- By emailing me and telling me you want to see/test drive it for 10 days (still gives you time to do that and get in under the Charter Member “wire” of 9/15)
Final note, we’ve had non-course entities (equipment manufacturers, course equipment providers (golf cars, turf/irrigation etc.) inquire regarding how they can subscribe for the summary results monthly. We haven’t yet figured out the configurations or details on that but happy to talk about your needs and whether our configuration and measures can meet those and, of course, based on our success in building the size and breadth of the network (all of which goes into the Charter Member Revshare “pot” to the benefit of the direct participants who are in on the ground floor). On to August’s results, waiting with bated breath!
The Pellucid file:
Reader feedback:
I had several email exchanges last week with readers who both and disagreed with my premise in the last issue of “Results Continue Coming Up Roses; Why?” Most agreed with my premise that we haven’t solved the puzzle of time, money & skill as primary barriers was correct but several pointed out that either a) the consumer was lying or b) we’re attracting all the “other people” who weren’t in the majority of adamant non-triers which were open to trying it and, upon doing so, found enjoyment in it beyond time, money and skill. I was personally reminded of that as I played a twilight 9-hole round with a friend last week who was a lapsed golfer. We went to the local muni, paid our money, teed it up, didn’t keep score and hit enough good shots over the course of our 90 minutes together out there that he wanted to return. The outdoors, the conversation and the laughing over missed putts and mis-hits completely overcame the fact that neither of us played well and, if we were keeping score, we wouldn’t have scared 45! Perhaps that’s what’s being unlocked among our new and returning golfers and, if so, that potentially has more legs than trying to convince the “anti-golfers” to come join our sport. We’ll see; opinions are like belly-buttons, everyone’s got one.
Upcoming Speaking/Writing Engagements:
The August Pellucid Perspective was dual-headlined by Jim Koppenhaver and Craig Kessler the Dir. of Governmental Affairs for the Southern CA Golfers Assoc. in a point-counterpoint discussion of the LA municipal golf portfolio management RFP. It got quite a few responses and comments so if you missed it, go check it out here:
https://www.nxtbook.com/nxtbooks/pellucid/perspective_202108
We’re always on the lookout for additional sponsors at initial investment levels as low as $5K for six months for 1 half-page ad per issue. We’re continuing our successful options led by an attractive 12 month package consisting of a slight monthly discount ($9K annual) and a bundling of Pellucid information services for your organization (i.e. OtR, State of Industry, Weather Impact etc.). We’ve also recently opened options for 3 month sponsorships and less-than-half-page layout options for organizations which want exposure to Pellucid’s audience and our respected publication but can’t commit to $5K initially. For any of you interested in exploring further, contact Jim Koppenhaver (jim@pellucidcorp.com) or 847-808-7651).
Product News:
As a preview of coming attractions, we’re finishing the quality control checks on the ’20 update of the Golf Local Market Analyzer software product. More on that to come but it will obviously change the dynamics of supply/demand, the golfer base, average facility velocity etc. that are components of our industry-leading market analysis tools. In addition, the GMRC will get updated DMA data in the Market Profile reports by September which will come from the updated GLMA. Watch how all those numbers jump and change for any of the 179 US Designated Marketing Areas!
As always, samples of all our publications, reports and services are available on the Products page of the Pellucid website. Thanks for your continued support as an OtR subscriber!
![]() ©Copyright 2021 Pellucid Corp. All rights reserved. Quotations permitted with prior approval. Material may not be reproduced, in whole or part in any form whatsoever, without prior written consent of Pellucid Corp.
©Copyright 2021 Pellucid Corp. All rights reserved. Quotations permitted with prior approval. Material may not be reproduced, in whole or part in any form whatsoever, without prior written consent of Pellucid Corp.